Live conditions · All 10 regions
Welcome to Guyana.
Weather, rivers and flood watch for every region of the country, on one living map of the real Earth.
01The land
A country of forest, rivers and savannah.
On the Atlantic coast of South America, between Venezuela, Brazil and Suriname.
- Land area
- 0km²
- Forest cover
- 0%+
- Regions
- 0
02The name
The Land of Many Waters.
The name comes from an Indigenous word for "land of many waters". The Essequibo, Demerara, Berbice and Corentyne carry the rain of the interior to the sea.
- Essequibo River
- ~0km
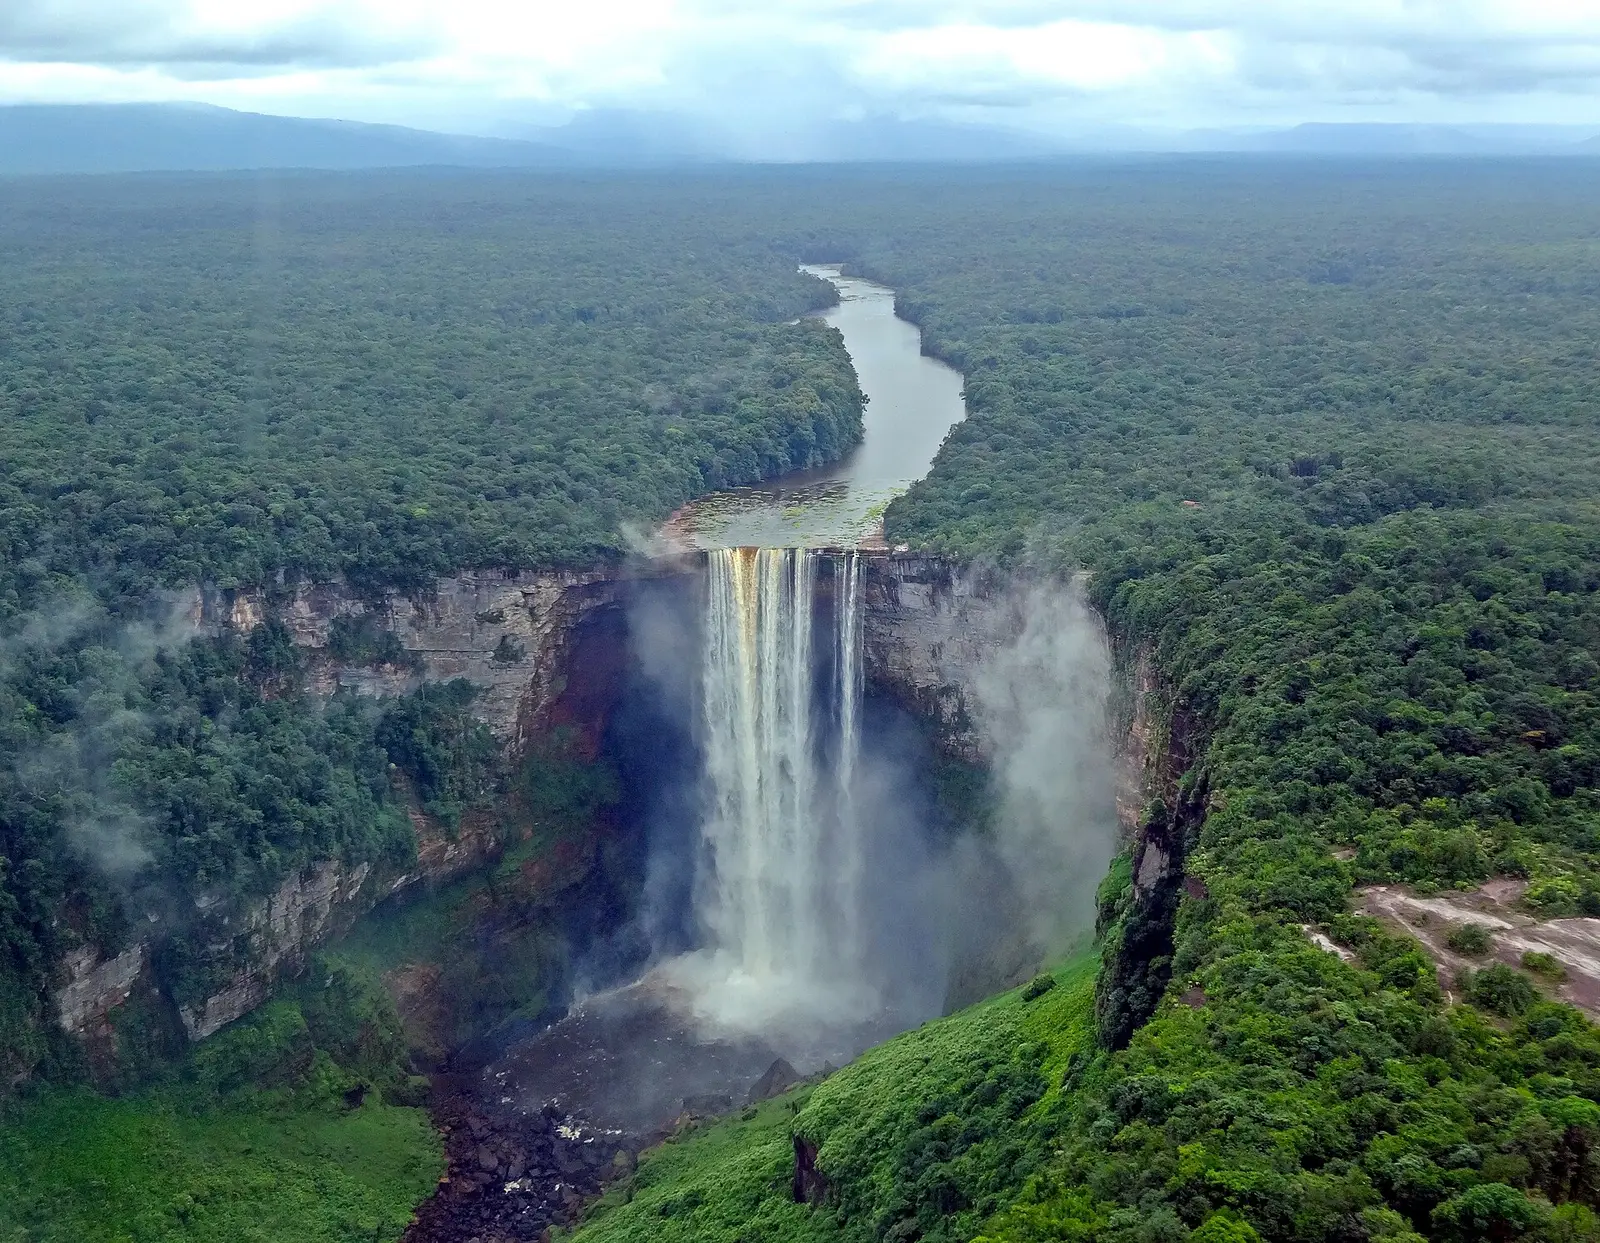
03Kaieteur Falls
226 metres. A single drop.
The Potaro River plunges into its gorge at one of the most powerful waterfalls on Earth.
04The people
One nation, many peoples.
The only English-speaking country in South America. Most Guyanese live along the coast, much of it below high-tide level, protected by the sea wall.
- Population
- ~0
- Live on the coast
- ~0%
05Guyana Live
Every region. Live.
- 01Weather & rainCurrent conditions and the next 24 hours, updated every 20 minutes.
- 02Rivers & flood watchModelled river flow and a transparent flood-risk estimate.
- 0327 places, real photosSee what Guyana actually looks like, region by region.
Estimates from computer models, not official warnings. For official alerts, follow Hydromet and the Civil Defence Commission.